Dashboard & Reporting With CIPA
Actions
Why Choose CIPA’s Dashboard & Reporting Module?
CIPA’s Dashboard & Reporting module delivers powerful capabilities to transform your data into actionable intelligence, providing real-time analysis of KPIs, production metrics, compliance status, and quality indicators for instant operational insights. The platform enables fully customizable reporting, tailoring outputs to your specific organizational requirements and quality standards, while interactive data visualization tools—including dynamic charts, tables, and maps—make complex information intuitive to explore. These features combine to enhance decision-making with precise, business-focused reporting that highlights critical metrics.

What We Offer
Key Features of CIPA’s
🛠️Dashboard & Reporting🛠️
📊 Dynamic & Customizable Dashboards 📊
-
Real-time performance tracking → Monitor production workflows, data integrity, and compliance with live indicators.
-
KPI displays → Configure and track production KPIs, quality deviations, regulatory compliance, and other custom metrics.
-
Alerts & notifications → Receive automated alerts for threshold breaches or process anomalies.
-
Interactive, filterable charts → Drill down into data by time, department, product, batch, etc., for deeper analysis.
📋 Detailed & Custom Reports 📋
-
Audit & compliance reports → Automatically generate reports for internal/external audits, ensuring adherence to ISO, GMP, and other standards.
-
Automated production reports → Create reports on production output, defect rates, volumes, and more directly from CIPA.
-
Fully customizable reports → Tailor fields, data types, and formats to meet department-specific needs.
-
Multi-format exports → Download reports as PDF, Excel, or CSV for easy sharing and offline analysis.
🔍 Predictive Analytics & Insights 🔍
-
Historical data forecasts → Leverage past data to predict future production performance and quality trends.
-
Trend analysis → Identify recurring issues or anomalies to take corrective action before they impact quality.
-
Cost & savings tracking → Measure financial impacts of efficiency gains and cost-reduction initiatives.
🔒 Data & Report Security 🔒
-
Role-based access control → Restrict sensitive dashboards/reports by user permissions to ensure confidentiality.
-
Full report history & traceability → Every report includes a detailed audit trail for compliance.
-
E-signature validation → Integrate electronic signatures to verify report integrity and approvals.

Actions
Added Value for Your Company !
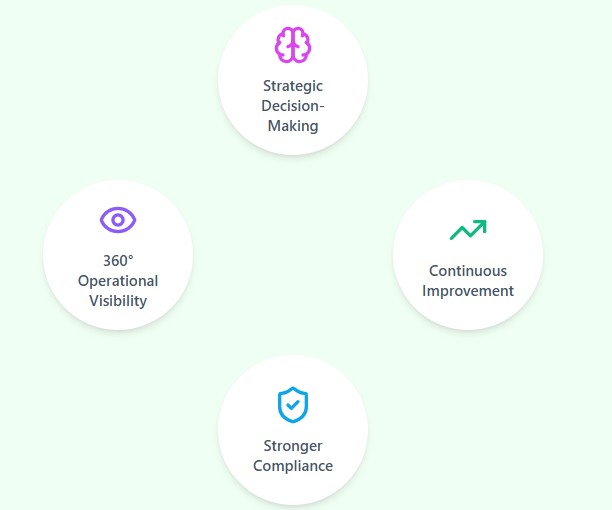
CIPA drives operational excellence by enabling continuous improvement through data-driven identification of optimization opportunities, while ensuring stronger compliance with rigorous reporting that meets industry standards. The platform empowers strategic decision-making by delivering actionable insights to enhance production, quality, and efficiency, all supported by 360° operational visibility that provides a comprehensive, real-time view for informed decision-making at every organizational level—transforming raw data into a competitive advantage.
Actions
Testimonials and Use Cases
Frequently Asked Questions
How do I customize reports in CIPA?
Select fields, data types, and formats to match your organization’s needs.
Can reports be exported in different formats?
Yes, export as PDF, Excel, or CSV for easy sharing and analysis.
Is report revision history tracked?
Yes, every CIPA report includes a full audit trail for complete traceability.
Upgrade to Advanced Data Analytics with CIPA
Ready to test the solution?
Try CIPA for free for 14 days
Want full control over KPIs and reporting?
Schedule a demo with our team.
